
Stylz Sense / Advanced Analytics
Know what shoppers are asking for.
See what people search, engage with, try and add to cart. Connect the shopper journey to measurable actions on your own store.
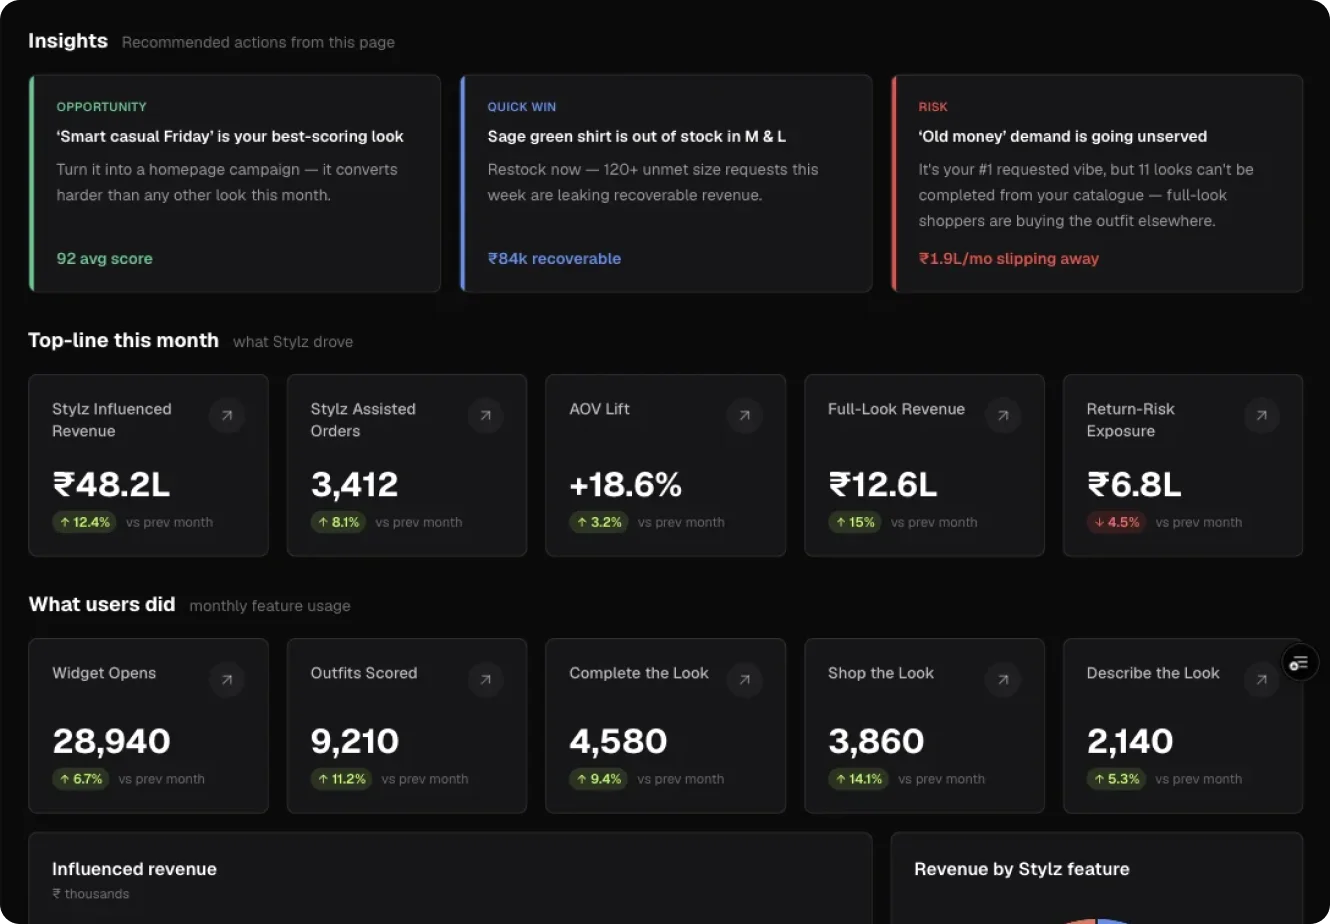
Interactive dashboard preview
Explore the numbers behind a sale.
Good morning, Admin
Store Overview
Stylz Sense drove 43% of your orders this month. Keep the momentum going.
- Revenue
- ₹112.4L
- 12.4%
- Orders
- 4,573
- 8.1%
- Visitors
- 326.4k
- 5.2%
- Conversion
- 1.4%
- 0.3 pt
Total revenue
- Store revenue
- ₹112.4L
- 12.4%
- Stylz-assisted revenue
- ₹12.7L
- 15%
11.3% of the store revenue
Revenue by day
Stylz-assisted revenue sits on the baseline so it can be compared day to day
Peak: 23 Oct · ₹4.9L
Your next moves
- Launch a linen co-ord set42 unmet searchesDemand
- Bundle a tan leather beltMissing from 118 looksLooks
- Restock sizes XS and S84–91% sell-throughFit
- Replace “Denim refresh”CTR 1.6% vs 3.7% bestAds
November report ready
Your Intelligence Report is ready
Wins, gaps and the three moves worth making this month, in one deck.
Open report →Traffic & Conversion
Who came, what they looked at, and what they did
Total visitors
326.4k
3.1% of visitors used Stylz, and they placed 43.4% of all orders.
Conversion
Stylz shoppers convert at 14 times the store rate
14×
1.4%
Store conversion
19.6%
Stylz conversion
Where shoppers drop off
% of each group still in the journey at every step (both start at 100%)
Biggest gap: product page → cart. 47% of Stylz shoppers add to cart vs 7% of all visitors.
Orders by day
4,573
Stylz Sense impact
How Stylz Sense helped
Stylz-assisted revenue
₹12.7L15%
11.3% of store revenue
Assisted orders
1,9839.6%
43.4% of all orders
Conversion lift
14×11%
19.6% vs 1.4% for everyone else
Top products by revenue
Bar length = revenue · Stylz share = part of that revenue Stylz assisted
| Product | Revenue | Conv. | Stylz share of revenue |
|---|---|---|---|
| Men Linen Mix Shirts-White | ₹11.4L | 2.5% | 13% · ₹1.5L |
| Men Boot Cut Linen Slub-Navy | ₹10.3L | 2.6% | 13% · ₹1.3L |
| Men Army Twill Shirts-Olive | ₹8.5L | 2.5% | 21% · ₹1.8L |
| Men Knitted TXO Shirts-Brown | ₹7.5L | 2.3% | 9% · ₹68k |
| Men Waffle Dobby Shirts Mandarin Collar-Beige | ₹6.6L | 2.1% | 9% · ₹62k |
| Linen Pleat Traveller-Cream | ₹5.7L | 1.9% | 7% · ₹39k |
Daily revenue
Assisted revenue by last feature
What the shopper used right before buying
- Complete the look₹4.7L
- Outfit score₹3.9L
- Shop the look₹2.3L
- Describe the look₹1.1L
- Try-on₹0.7L
Stylz Sense engagement
How shoppers are using Stylz Sense on your site
Time spent shopping
Average session with and without Stylz
5× longer
5 min
Avg. store session
15% drop-off
25 min
Avg. session with Stylz
5× more engaged
Widget opens
9,4206.7%
3,080 distinct shoppers
Sign-in rate
85%2.1 pt
2,610 signed in
Profile completion
75%4.1 pt
1,954 profiles
Repeat usage
28%5 pt
546 came back
Feature adoption
of 3,080 shoppers who opened Stylz used a tool
59%
- Outfit score2,140 of 3,080 · 69%
- Complete the look1,180 of 3,080 · 38%
- Shop the look640 of 3,080 · 21%
- Describe the look510 of 3,080 · 17%
- Try-on380 of 3,080 · 12%
- Similar picks290 of 3,080 · 9%
Where shoppers open Stylz
- Score badge4,120
- Complete the look2,380
- Search pill1,490
- Try-on860
- Just for You570
9,420 widget opens this month
Looks & Outfits
How well your products style together
Average outfit score
782.6%
Fit 74 · colour 81
Looks generated
2,3109.4%
1,180 Complete the Look requests
Look-to-purchase
7.1%1.2 pt
84 orders carried a look
Full-look purchases
31%3 pt
26 of 84 bought 2+ items
Top looks
The looks shoppers bought from
| Look | Shown | Carted | Orders | Revenue |
|---|---|---|---|---|
| Linen shirt + wide jeans + tan belt | 412 | 48 | 14 | ₹11.6k |
| Sage shirt + pleated skirt | 388 | 41 | 11 | ₹9.1k |
| Knit dress + trench + loafers | 296 | 29 | 9 | ₹8.4k |
| Chinos + overshirt | 244 | 18 | 5 | ₹3.8k |
Outfit score distribution
Every scored outfit this period
Look vibes shoppers ask for
Tagged from Describe the Look prompts
- Old money24%
- Clean girl21%
- Smart casual19%
- Streetwear16%
- Festive12%
Virtual Try-On
How shoppers try your products on themselves
Try-ons
355
Avg 51 try-ons a day
Click-to-result
75.8%
● Good
Try-on funnel
Shoppers at each step, past 30 days
- Clicked try-on950
↓ 76%
- Saw a result720
↓ 47%
- Added to cart339
↓ 28%
- Ordered96
Try-ons shown
1,41011.2%
Past 30 days
Shoppers who tried on
7208.6%
7.1% of Stylz shoppers
Click-to-result
75.8%2.4 pt
1,410 of 1,860 clicks
Try-on orders
969.8%
₹2.4L revenue
Demand & Intent
What shoppers ask for in their own words, including what you don’t sell
Keywords & search intent
| Stylz Sense keywords | Searches | First seen | How shoppers phrased it | In catalogue | Past 30 days |
|---|---|---|---|---|---|
| Wedding Guest | 68+40% vs prev 30d | 23 days agoRising | wedding guest sareesangeet outfit+ 5 more | Partial match | |
| Old Money | 54+22% vs prev 30d | 30+ days agoRising | old money menquiet luxury+ 9 more | Found | |
| Airport Look | 41+18% vs prev 30d | 30+ days agoRising | airport outfitcomfy travel outfit+ 4 more | Found | |
| White Sneakers | 19−12% vs prev 30d | 30+ days agoFading | white sneakers menchunky sneakers+ 2 more | No result |
2 of your top 7 keywords return no product — 61 searches this month you couldn’t sell to.
Category gaining demand
Share of rising searches
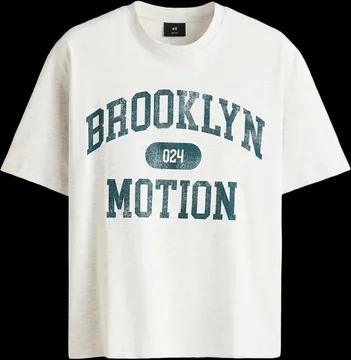
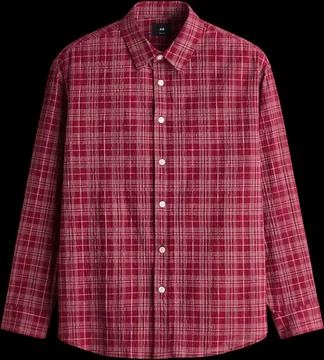
Topwear
19%
See more
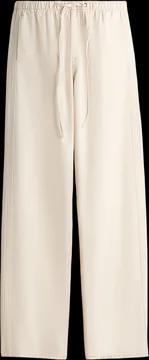
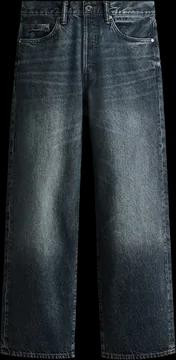
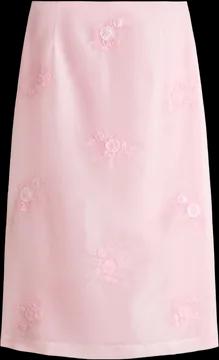
Bottomwear
24%
See more
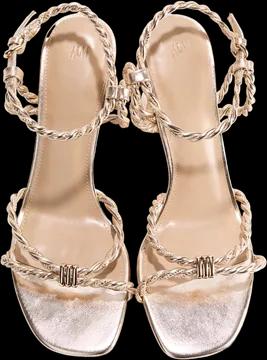
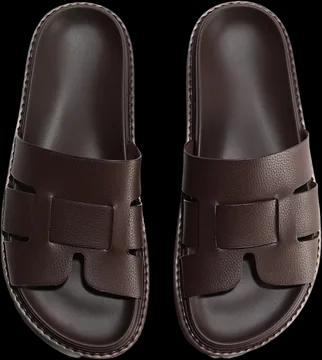
Footwear
10%
See more
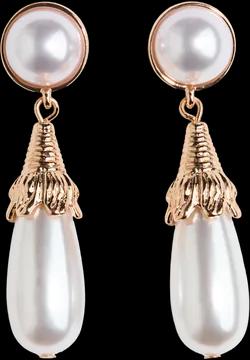

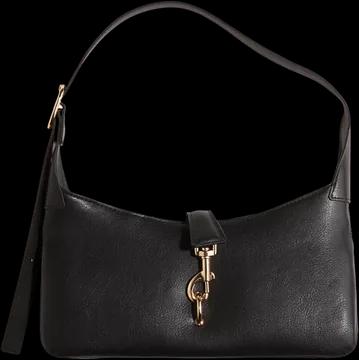
Accessories
47%
See more
Searches with no match
What shoppers asked for that you don’t stock
- linen co-ord set42
- white sneakers men19
- sage green kurta14
- chunky loafers9
- satin slip dress7
Examples use demo data. Available metrics depend on your store’s setup.
From day one to depth
Useful measures at every stage.
Early pilots should show activity honestly. More detailed patterns need enough volume.
What shoppers use
Opens, profiles, searches, product engagement and try-ons.
See it in a demo02 / ActionWhat follows
Cart adds, full-look actions and attributed orders with clear definitions.
See it in a demo03 / DemandWhat is emerging
Recurring intent and product gaps when the sample is large enough to interpret.
See it in a demoTrust the numbers
Every metric needs context.
The live dashboard should show calculation definitions, time range, denominators and data availability. Small samples are labelled instead of presented as strong trends.